Inside The Stock Market ...trends, cross-currents, and outlook
Peeking Ahead To November?

The stock market seems to relish the headlines it believes we’ll be reading three- to six-months from now. At the end of that window, of course, is the presidential election, and it’s impossible for us to see an outcome that doesn’t deepen the partisan chasm.
Why The Long Faces?

Despite our reservations about the durability of the expansion, we have to respect what it has overcome: interest-rate hikes of 425 bps; a nearly 2-year runoff in the Fed’s balance sheet (QT); and a 9-month bear market that began before the expansion reached its 2-year milestone. Even consumer “expectations,” which track the market higher in the early phase of a bull market, never rebounded and are lower now than at the fall-2022 market low.
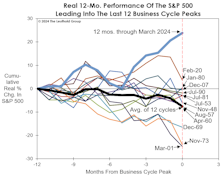
The Bull Vs. Historical Peers

Now at the bull market’s one-and-a-half-year mark, it’s notable that every major stock index has trailed the average path for a new bull market at this point in a cycle. But, it’s unfair to liken today’s bull with past bulls, because it has a unique adverse trait that is apt to be life-shortening: It arose during an economic expansion—and likely in the latter stages, considering the unemployment rate was 3.5%.
Are Prices Impeding A Factory Recovery?

The U.S. manufacturing sector has been in a mild recession for more than one-year-and-a-half, with only a single reading in the ISM Manufacturing Index north of the 50 level since September 2022. And since June 2022, there were only two months in which the ISM New Orders Index poked above the 50 expansion/contraction threshold.
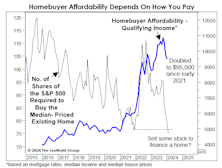
Are Prices Impeding Recoveries Elsewhere?

The Federal Reserve’s ultimate inflation-battle success will be judged entirely on the performance of aggregate numbers, like Core and “Supercore” inflation, and the PCE Deflator. However, we think it’s unlikely that certain cyclical sectors, such as housing and autos, can recover in the absence of outright price cuts in the year ahead.
Powell Could Pull Off A Rare Feat

Powell could be remembered as a Fed Chair who was apolitical to a fault, and there’s one last item that would cement his legacy of political independence: Jay could well preside over another election-year decline into recession (as in 2020). If so, he will have achieved it with a president from each major party. Powell would emerge as the ultimate non-partisan—and an effective enforcer of single-term presidencies.
Bubble “Resistance” Proves Formidable

Many pundits would contend that a stock-market bubble can’t exist (or even develop) with consumer pessimism as widespread as today. We are not so sure, but we currently don’t think U.S. Large Caps quite qualify as a mania, either, since the stock market was just rebuffed at three of the four valuation thresholds we use for making that determination. Bubble or not, if the market peaks out here, it will represent the third most-expensive top in the history of our valuation work.
Too Calm For Comfort?

Can the stock market become so calm that it’s dangerous? The volatility of the S&P 500 Implied Volatility Index (VIX®) can provide a clue.
Technical Tidbits

The MTI’s Technical category remains at a net reading of +3, and is the only bullish pillar supporting its Neutral stance. Most of the Technical strength reflects positive scores across our trend and momentum disciplines.
“Great Quarter, Guys!”
After the market just delivered investors their “birthright”—a full-year average total return of +10.5% in just a single quarter—it’s fun to imagine how a quarterly analyst call with the “management” of S&P 500, Inc. might sound.
Steve’s Sagacious Advice
Near the turn of the millennium, Steve Leuthold compiled investment advice as part of an essay, “Managing Your Mother Lode… Your Serious Money,” which was later published in the 2002 book, The Global-Investor Book of Investing Rules: Invaluable Advice from 150 Master Investors. This month we reprint what Steve liked to call his “Ten Commandments.”
A Hugely Productive Rally
Rallies of this magnitude (+30% in 5-6 months) are not uncommon; however, this one began one year into a yield-curve-inversion cycle and with stock valuations already elevated. The latter condition could be viewed as a positive because the market surge has created one of the most pronounced short-term wealth effects in history.
Stock Price “Seepage?”
The decade of the teens showed that asset price inflation could persist for an extended period without spreading to consumer prices. That likely reflects the economic slack that existed for the first several years of the decade.
Bubble Or No Bubble?
Is the stock market forming another bubble? Market “sentimenticians” assure us it’s not, and rightly point out that today’s AI craze is not yet on par with the silliness of the meme stock and SPAC manias of 2021. However, the mention of that year in any discussion of stock market sentiment is itself a clue that investors are lathered up.
What It Will Take To Earn “Average” Returns
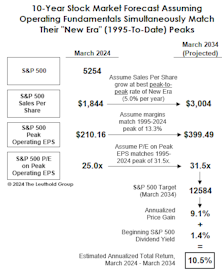
If spectacular fundamental performance over the next ten years is required to produce merely average stock market results, what might be in store if the fundamentals instead adhere to that antiquated notion of “mean reversion?” The answer might have you paying closer attention to the next Treasury bill auction.
Too Soon To Ditch The LEI
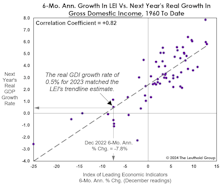
It’s possible to focus on the right things at the wrong times, and there’s no better example in recent years than investors’ initial fixation with—and subsequent dismissal of—the yield curve inversion.
Profits: Give Credit Where It’s Due
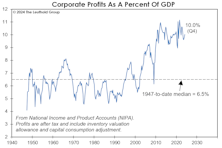
Twenty-five years ago, few investment axioms were held more dearly than the belief that corporate profit margins were “the most mean-reverting series in finance.” Today, if there’s anyone still clinging to that belief, he or she is unwilling to say it publicly.
In Hindsight, It Was Obvious!
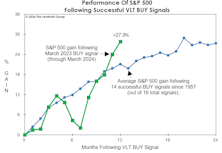
The S&P 500’s Very Long Term (VLT) Momentum algorithm generated an immensely profitable low-risk BUY signal in March 2023. Its trajectory since then has vaulted ahead of the average gain following profitable signals back to 1957, and historical results call for still higher prices over the next year, albeit at a likely more muted pace.
Implications Of A Great First Quarter
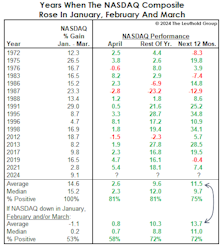
Realizing a gain in each of the first three months of the year, like Q124, is not as bullish for the next twelve months as are back-to-back gains in January and February. The three-month streak produces a one-year performance advantage of around 2%, while a string of Jan-Feb gains was additive by 900 bps.
Technicals: Four On The Floor!
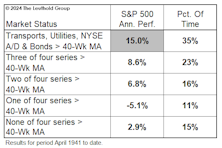
The market upswing is now confirmed by Cyclicals, Defensives, Breadth, and Bonds. Endorsement by all four occurs about one-third of the time and has led to an S&P 500 average annualized compound return of +15%.
current issue